Disclaimer: Some information in this case study has been modified or generalized due to sensitive content and confidentiality requirements associated with government projects.
OVERVIEW
For teams managing complex material workflows, tracking progress across disconnected tools often leads to errors and inefficiencies. I designed a simulation that provides a single, clear view of material movement through the entire workflow, enabling teams to identify bottlenecks, optimize processes, and improve overall operational efficiency.
MY ROLE
As the lead UX designer, I collaborated closely with developers, project managers, and stakeholders to translate complex workflow requirements into an intuitive simulation. I led user research, created wireframes and high-fidelity designs, and ensured the final product provided a clear, actionable view of material movement across the workflow.
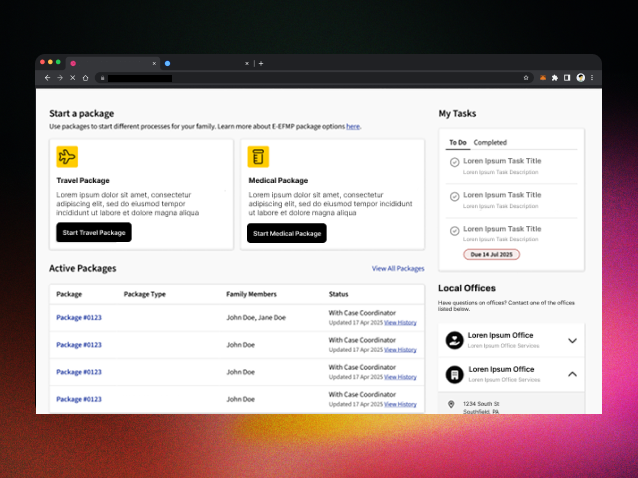
SIMULATION SELECTION
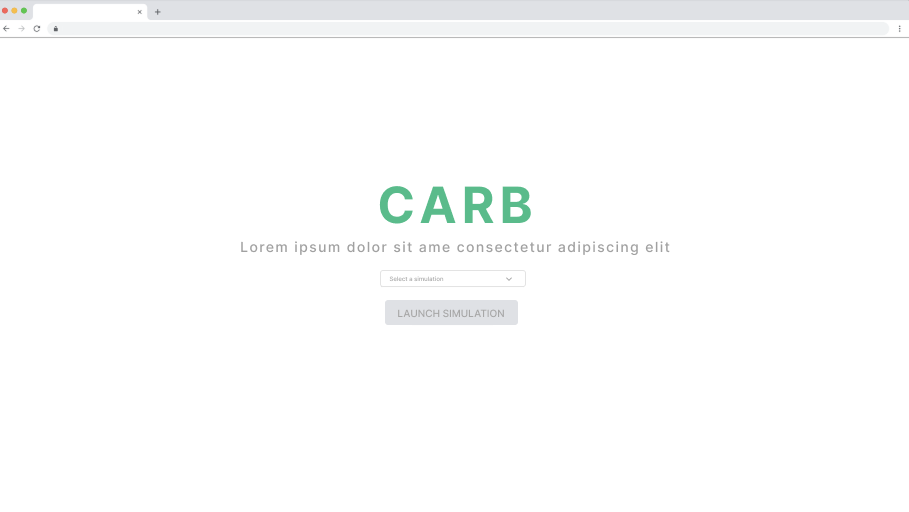
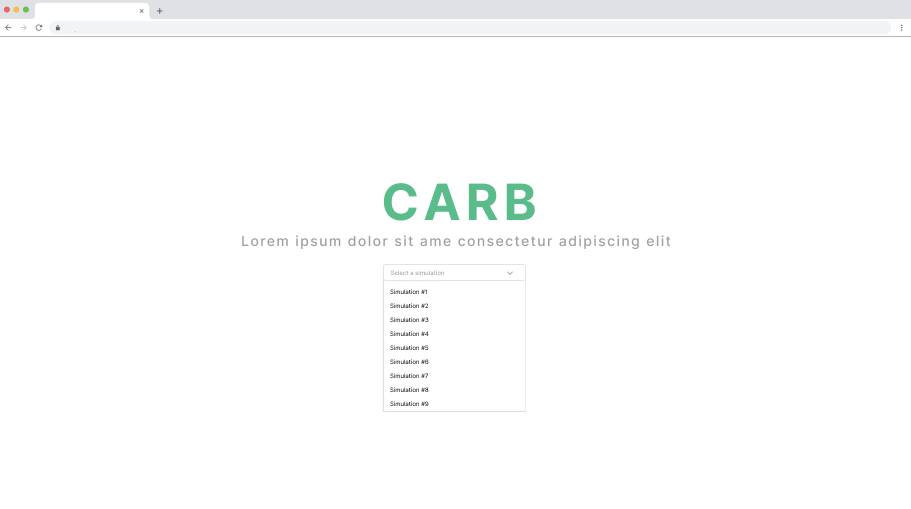
The dropdown lets users select a specific simulation to evaluate. This ensures the correct workflow is being analyzed, providing a focused view of material movement and allowing teams to accurately assess, track, and optimize each process.
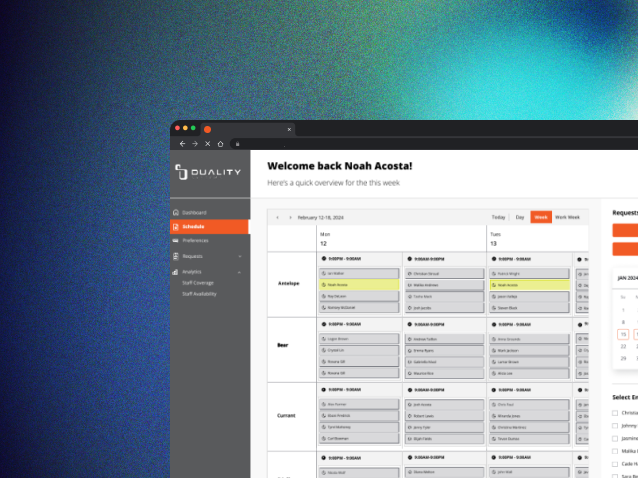
REAL TIME MOVEMENT
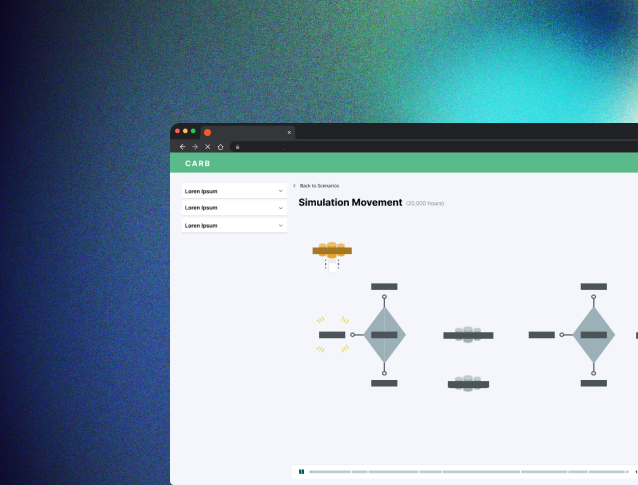
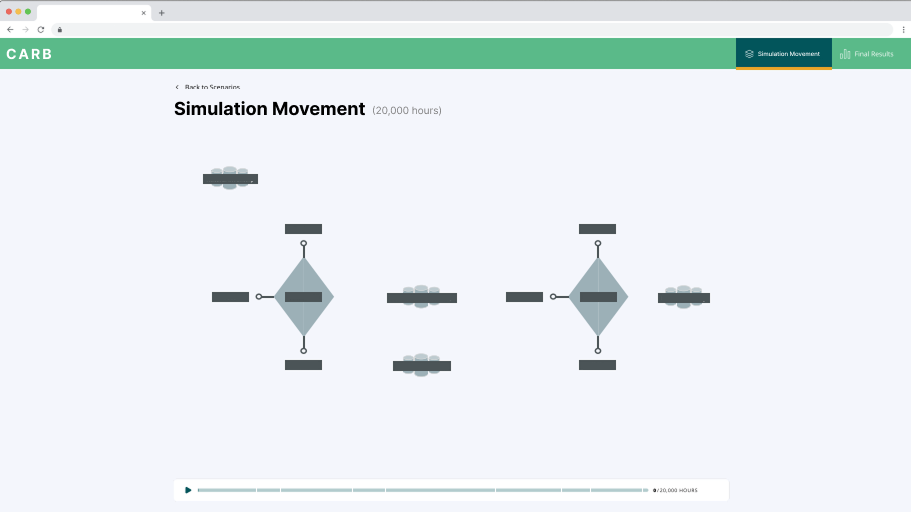
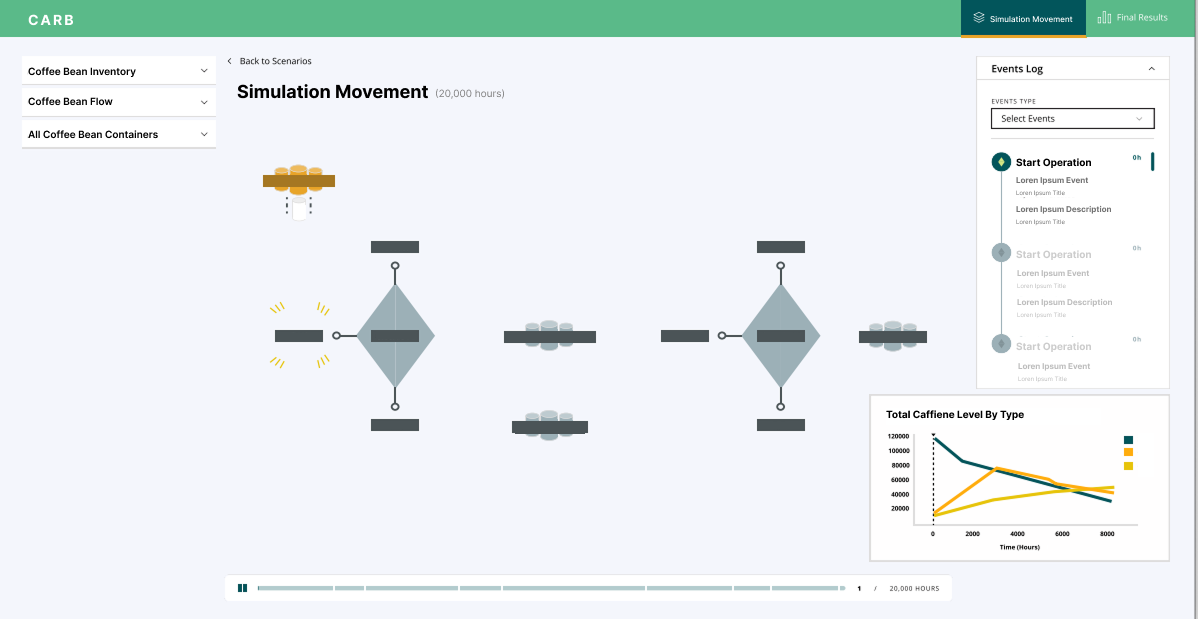
The real-time simulation view lets users track material movement as it happens. The timeline at the bottom provides control over playback, allowing users to pause, rewind, or fast-forward the flow and closely analyze each step of the process for insights and optimization.
EVENT FILTERS
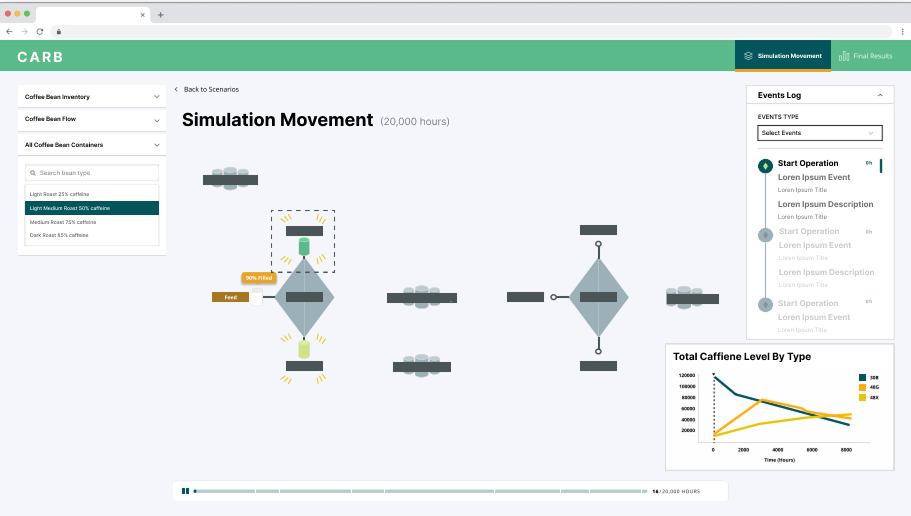
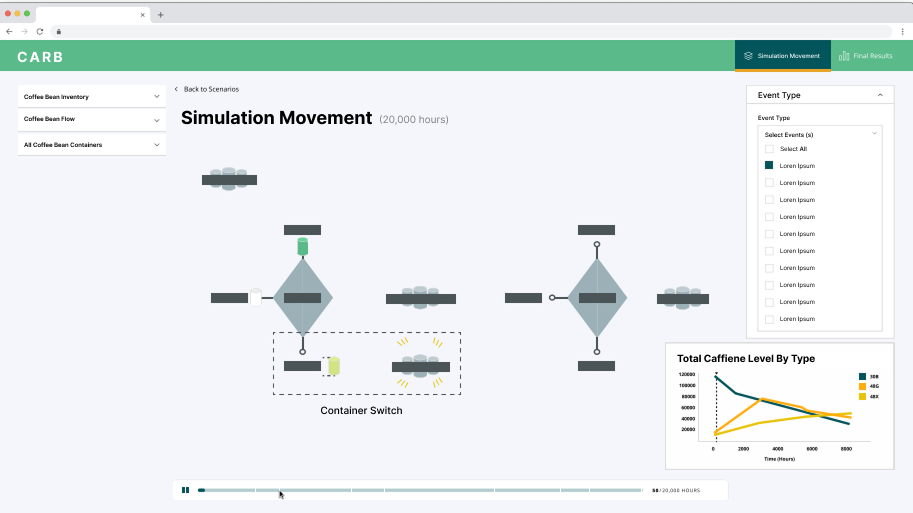
The side filter lets users focus on specific points within the simulation. By selecting criteria, users can highlight particular materials, stages, or events, making it easier to analyze critical moments and pinpoint opportunities for improvement in the workflow.
DROPDOWN LIST
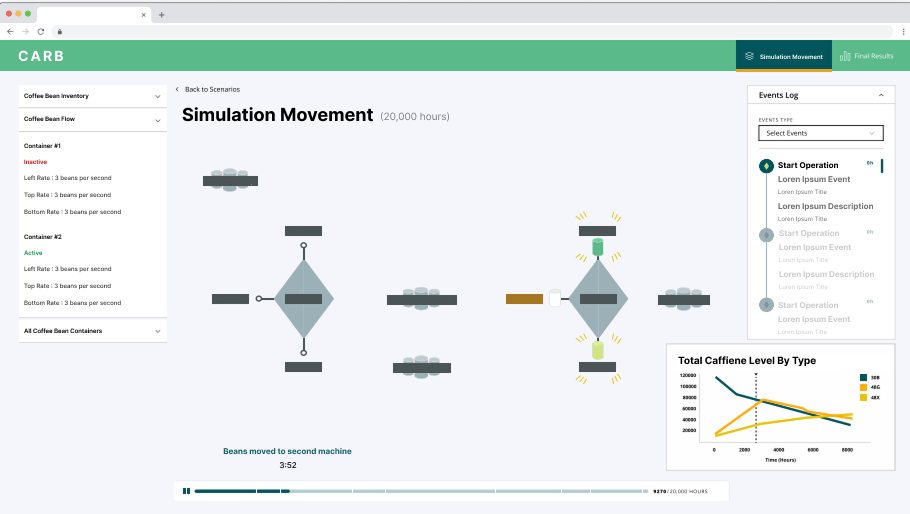
The dropdown list provides detailed information about each material as it moves through the simulation. Users can see key data points in real time, track progress, and gain insights into how each item interacts with the workflow.
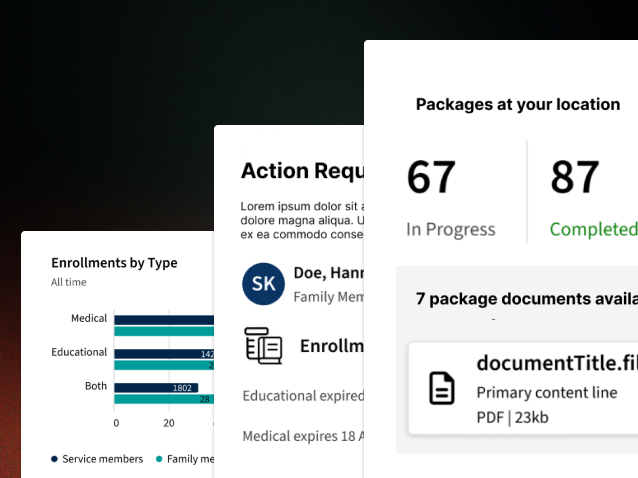
GRAPH TIME TRACKING
Alongside the timeline, I designed a real-time graph that tracks material movement by type over the hours of the simulation. This visual representation allows users to quickly identify trends, bottlenecks, and throughput patterns providing actionable insights.
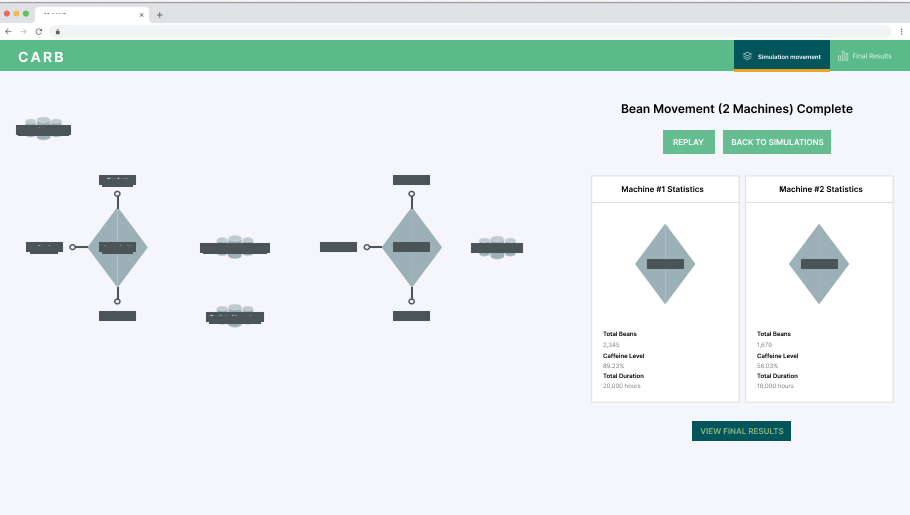
FINAL RESULTS
The final results screen displays the completed material flow from all containers, giving users a clear summary of the simulation outcome. Users can replay the simulation or switch to another scenario to compare results and analyze different workflows.